Database management and Big Data Analysis Methods

Data Collection
This project draws on two primary datasets, Immigration and Customs Enforcement (ICE) arrest records obtained through the Deportation Data Project, which acquires enforcement data from the U.S. government primarily via FOIA requests. The ICE dataset used spans September 1, 2023 through October 15, 2025 and was filtered to include only arrests occurring within the Los Angeles area.
The second dataset was obtained through school absenteeism reports from the California Department of Education’s DataQuest system. Data was collected from 14, K-12 schools located within two miles radius of the identified ICE raids that occurred in June 2025. For each school, I collected official absenteeism metrics, including Total Days Absent, derived from the number of students with one or more absences and the breakdown of excused, unexcused, and average absences. These data were processed using Python to compute year-to-year changes across the 2023–24 and 2024–25 school years. Each school year begins July 1 to June 30.
Data Preprocessing
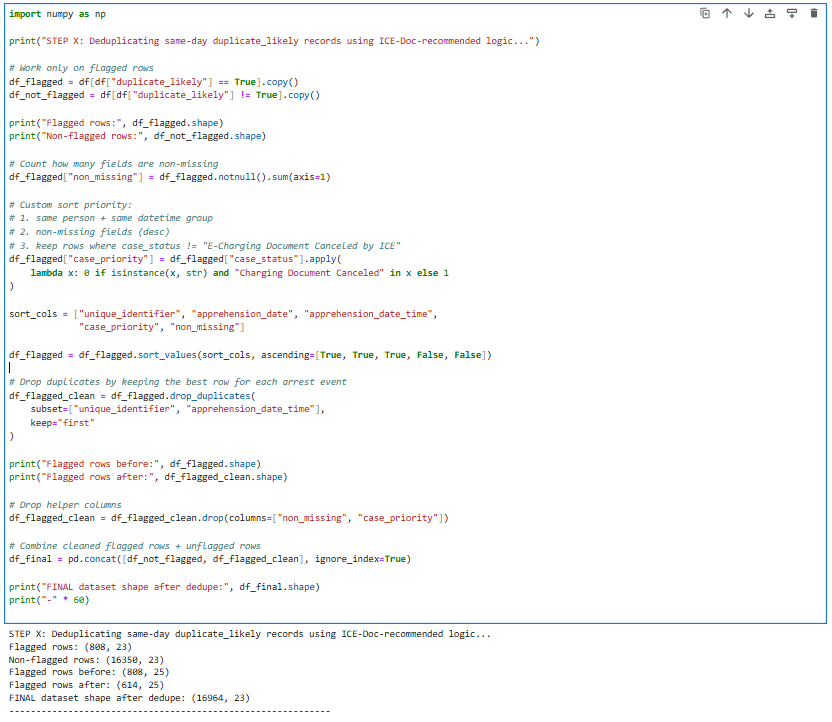
All arrest data was imported into a Jupyter Python notebook for preprocessing and analysis. Initial exploratory data analysis (EDA) assessed data completeness, identified missing values, and detected duplicate arrest entries. Following the ICE documentation, it recommended implementing a deduplication procedure. I removed same-day duplicate records by prioritizing entries with greater completeness and more reliable case-status information. This process removed approximately 200 duplicates, resulting in a cleaned dataset of 16,964 arrest records with 23 fields. The cleaned data were stored locally in both Excel and CSV formats and analyzed using Python, primarily pandas and NumPy.
Figure 1: Python Script to depuplicate Arrest Data
Data preparation included standardizing date formats, converting text-based numerical fields into usable numeric values, parsing percentages, and generating new variables such as year, month, day, and percent changes in absence types. Creating time-based variables allowed aggregation at multiple temporal scales, enabling monthly, weekly, and daily analyses of arrest activity. Group by operations were extensively used to calculate totals by time period and to examine arrest patterns by apprehension method, gender, age, country of citizenship, and site of apprehension. Temporal and categorical analyses revealed a sharp increase in arrests during June 2025, particularly in community-based apprehension methods labeled “Located” and “Non-Custodial Arrest.” These patterns suggested heightened activity occurring within neighborhoods rather than incarcerated facilities. To contextualize these findings, I reviewed media reports confirming ICE raids at the Westlake Home Depot and at Ambiance Apparel in the Fashion District during this period, where dozens of people were reportedly arrested.
Visualization methods included matplotlib line plots that illustrated monthly arrest trends, daily event spikes, and comparative year-to-year changes. Descriptive statistics and percent-change calculations were used to compare overall enforcement levels between 2024 and 2025, helping standardize comparisons across unequal time ranges.
Together, these database management and analytical methods provided a robust quantitative foundation for identifying June 2025 as a period of unusually elevated community-level enforcement and for examining whether local school absenteeism patterns shifted in response