The Analysis on ICE Arrest Data

Exploratory analysis revealed a pronounced spike in ICE arrests in June 2025. Compared to 2024, ICE arrests in 2025 increased sharply. Monthly averages rose by approximately 173%, meaning 2025 saw nearly three times as many arrests per month. Even with only ten months of data, 2025 already more than doubled the total number of arrests recorded in all of 2024, driven largely by an unprecedented spike in June 2025.
Community-based apprehensions rose sharply during this period, indicating that ICE intensified its operations in neighborhood settings rather than relying primarily on arrests from jail facilities.
Figure 2: Monthly ICE Arrests From 2023 to 2025 in Los Angeles
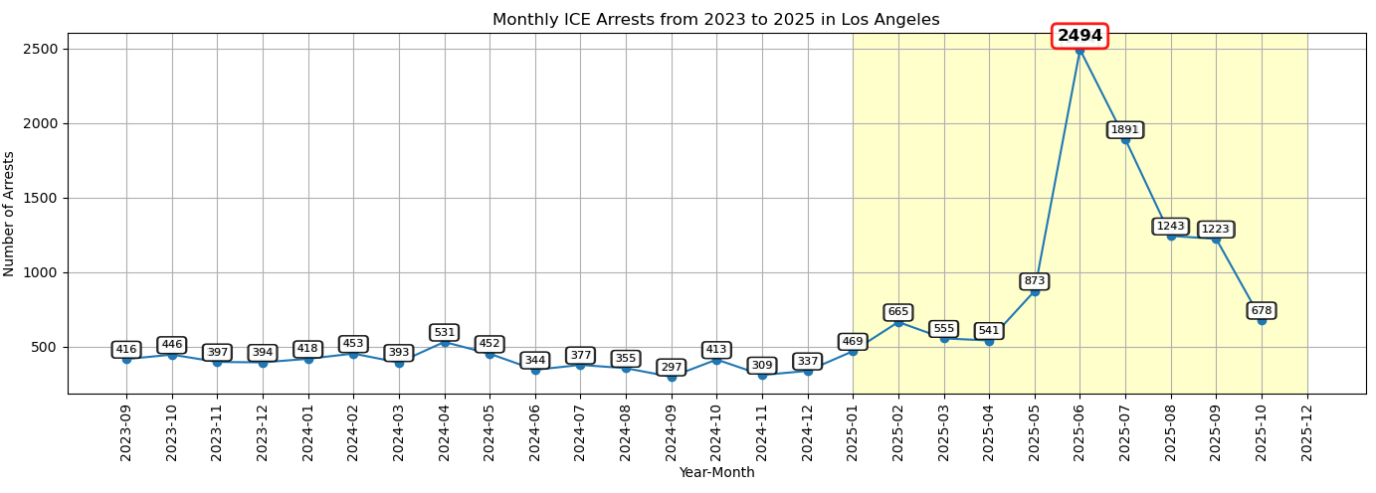
Figure 2: Monthly ICE arrests in Los Angeles show moderate fluctuations from September 2023 through 2024, followed by a dramatic escalation in early 2025 that peaks at 2,494 arrests in June. This mid-2025 surge represents the most significant enforcement increase in the entire period.
The daily arrest pattern in June 2025 reflects this shift: enforcement activity remained consistently high throughout the month, with arrests surpassing 100 on multiple days. The largest peak occurred on June 13 (148 arrests), followed by notable surges on June 5 (108), June 12 (132), June 17 (137), June 18 (119), June 22 (134), and June 30 (119).
Figure 3: Los Angeles Daily ICE Arrests in June, 2025
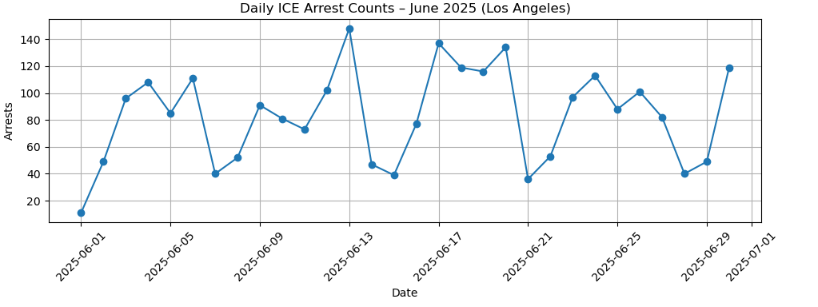
Figure 3: Daily ICE arrests in Los Angeles during June 2025 show consistently elevated activity with multiple peaks above 120 arrests, illustrating the intensity and frequency of enforcement throughout the month.
Between these spikes, daily arrests rarely fell below 40–50, demonstrating a sustained and coordinated enforcement presence rather than an isolated incident. This pattern aligns with the major escalation observed in the monthly data. It also echoes local reporting from CalMatters, which noted that “between June 6 and June 22, immigration enforcement teams arrested 1,618 immigrants for deportation in Los Angeles and surrounding regions of Southern California,” targeting individuals ranging from car wash workers and farmworkers to U.S. citizens and people attending immigration court hearings.
Across every day of the week, 2025 recorded dramatically higher average arrest levels than 2024. Weekday arrests roughly doubled, rising between 75% (Tuesday) and 128% (Friday), while weekend arrests showed the most extreme increases, with Saturday and Sunday totals surging by more than 700%. This shift indicates that ICE expanded operations far beyond typical weekday activity.
Figure 4: Average ICE Arrests by Day of Week (2024 vs 2025)
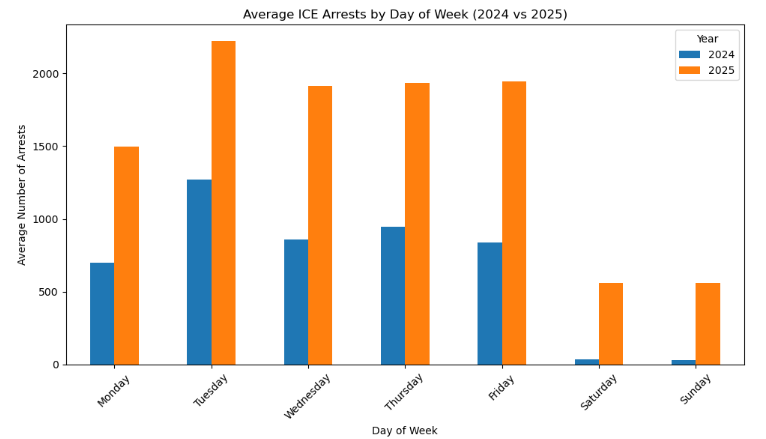
Figure 4: Average ICE arrests were substantially higher across every weekday in 2025 compared to 2024, with peak activity occurring Tuesday through Friday and minimal enforcement on weekends.
These patterns align with the sweeping federal funding increases enacted this year. The new $170 billion immigration and border enforcement package dramatically expands ICE’s operational capacity, including major investments in new detention centers and a tripling of the agency’s enforcement budget. By directing billions toward additional personnel, transportation, and processing infrastructure and creating a $10 billion discretionary fund for DHS with “very few guardrails” the legislation enables larger, more frequent enforcement operations (American Immigration Council, 2025). This national policy shift helps explain the unusually high arrest activity observed in Los Angeles during 2025.
Against this backdrop, demographic comparisons between 2024 and 2025 show substantial changes across gender, age, and country of citizenship among those arrested, underscoring the scale and targeted nature of the 2025 surge. These shifts are essential for understanding the broader community impact, especially in neighborhoods where families with school-aged children live and work.
Arrests increased across genders, though the rise was especially pronounced among men. Male arrests more than doubled, particularly among adults ages 25–50, a core segment of the labor force. The consistent rise across all 5-year age bands indicates that enforcement disproportionately targeted working-age adults, intensifying ripple effects on family routines, caregiving responsibilities, and ultimately school attendance.
Citizenship patterns show a similar escalation. Mexico remained the most common country of citizenship among those arrested, with a sharp increase in 2025. Significant rises also occurred among individuals from Guatemala, Honduras, El Salvador, and Nicaragua, reflecting concentrated enforcement in Latin American immigrant communities near the Westlake Home Depot and Fashion District raid sites. Although arrests of non–Latin American nationals were fewer, they also experienced modest increases.
Taken together, these demographic shifts reveal that the 2025 enforcement spike most heavily impacted working-age adults and families in immigrant-dense neighborhoods. Recognizing who was targeted helps contextualize why schools near these locations may have experienced shifts in absenteeism, particularly increases in excused absences driven by fear-based protective decisions made by families.
Figure 5: ICE Arrest Demographic Dashboard (2024 vs 2025)
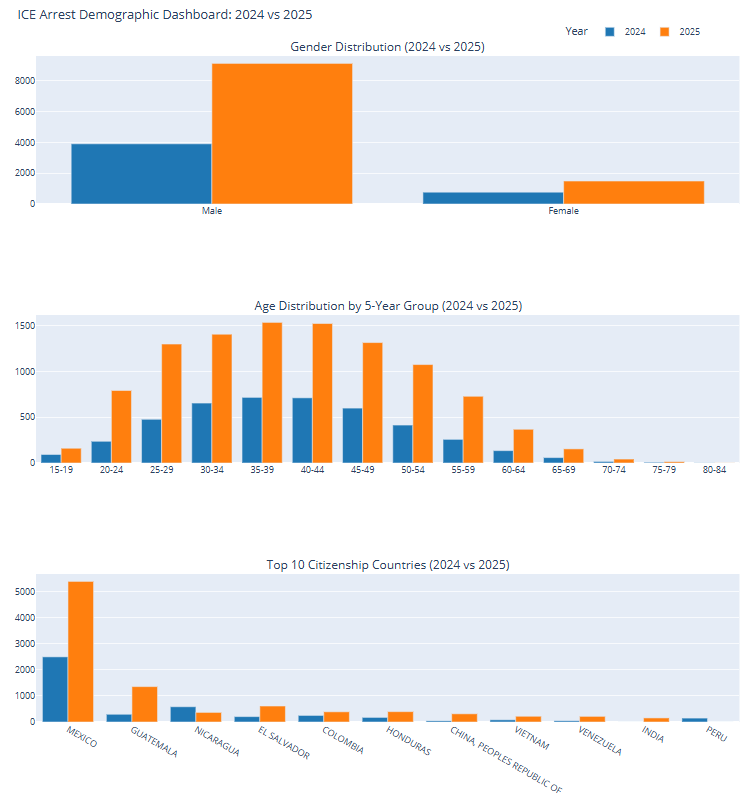
Figure 5: ICE arrests in 2025 show sharp increases across all major demographic groups compared to 2024, with arrests concentrated among men, adults ages 25–54, and individuals from Mexico, Guatemala, and El Salvador
Figure 6: Top 10 Apprehension Methods (2024 vs 2025)
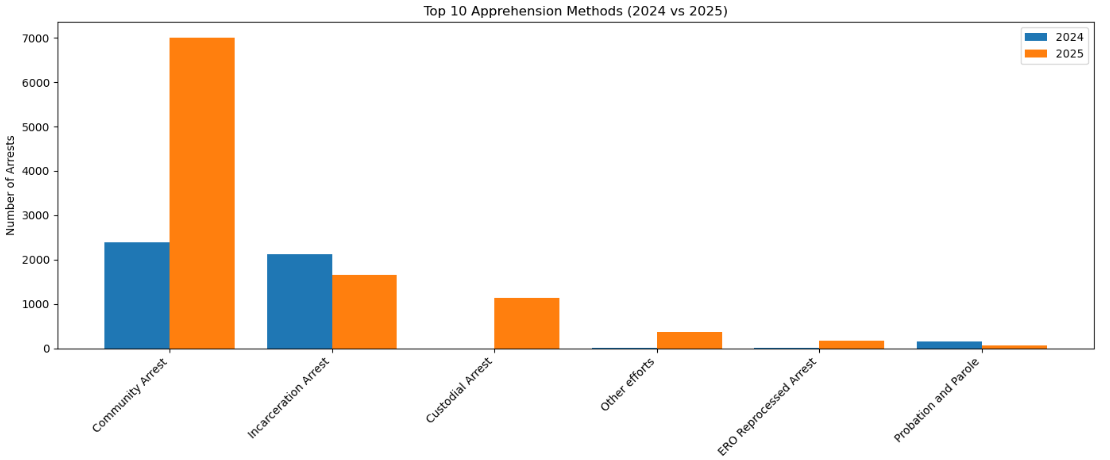
Community arrests drove the sharp increase in ICE activity in 2025, rising far above 2024 levels, while other apprehension methods saw smaller shifts by comparison.